aec_add_carto_f - computes and binds the cartogram coordinates to original data
Source:R/cartogram.R
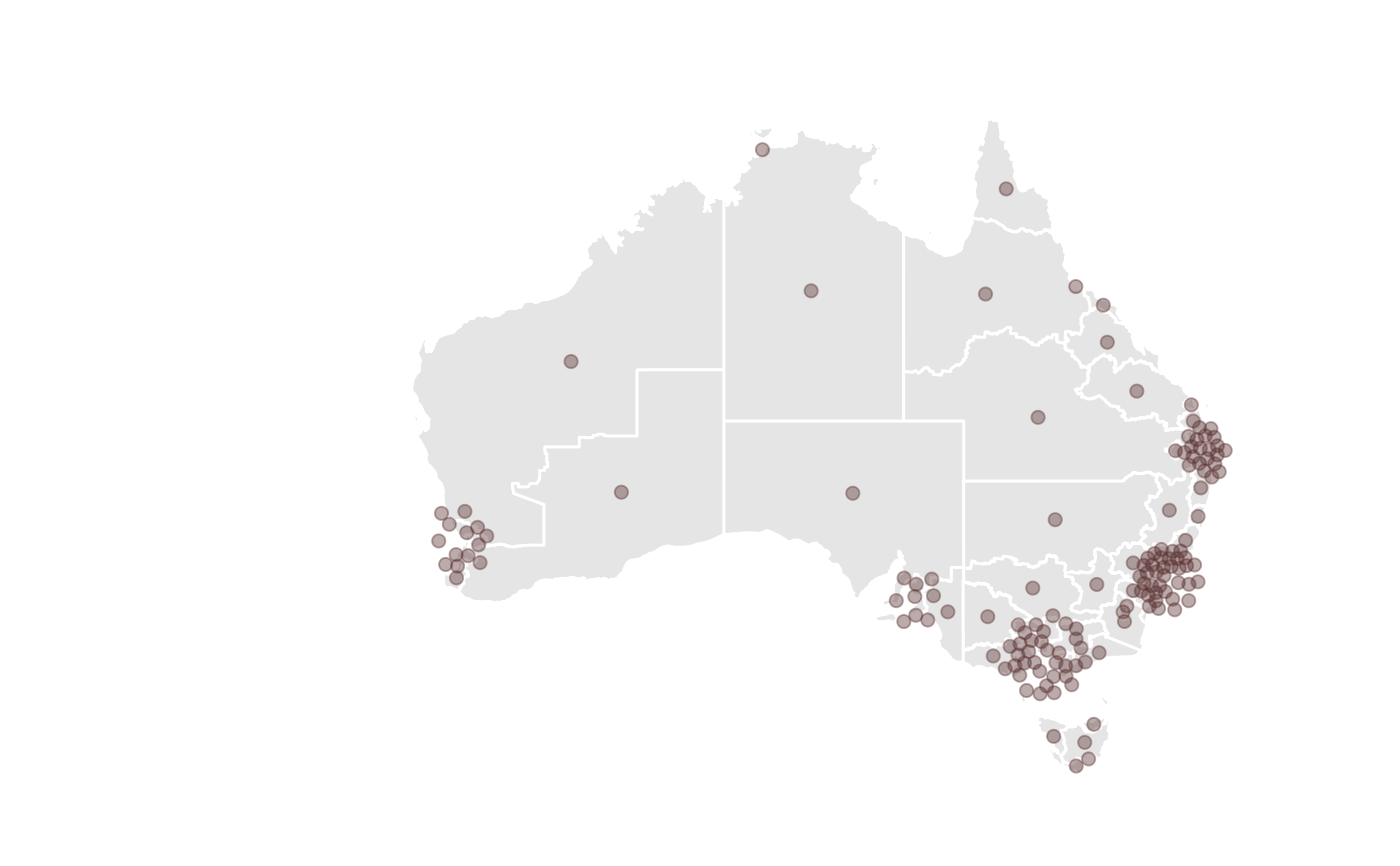
aec_add_carto_f.RdAdd the cartogram locations as new variables to original data and make any of these that were not made equal to the original centroids. This is simply all of the Australian electoral cartogram steps in one hit.
aec_add_carto_f(nat_data)Arguments
- nat_data
subset of data with centroids of electoral divisions
Examples
library(eechidna)
library(dplyr)
#>
#> Attaching package: ‘dplyr’
#> The following objects are masked from ‘package:stats’:
#>
#>     filter, lag
#> The following objects are masked from ‘package:base’:
#>
#>     intersect, setdiff, setequal, union
library(ggplot2)

nat_map16 <- nat_map_download(2016)
nat_data16 <- nat_data_download(2016)

nat_data16 <- nat_data16 %>% select(-c(x,y)) # remove existing cartogram coordinates
nat_data_cart <- aec_add_carto_f(nat_data16)
#> Iteration:  10

#> Iteration:  10

#> Iteration:  10


# Map theme
library(ggthemes)

ggplot(data=nat_data_cart, aes(map_id=id)) +
  geom_map(map = nat_map16, fill="grey90", colour="white") +
    geom_point(aes(x=x, y=y), size=2, alpha=0.4,
                 colour="#572d2c", inherit.aes=FALSE) +
    expand_limits(x=nat_map16$long, y=nat_map16$lat) +
    theme_map() + coord_equal()
# Map theme
library(ggthemes)
ggplot(data=nat_data_cart, aes(map_id=id)) +
geom_map(map = nat_map16, fill="grey90", colour="white") +
geom_point(aes(x=x, y=y), size=2, alpha=0.4,
colour="#572d2c", inherit.aes=FALSE) +
expand_limits(x=nat_map16$long, y=nat_map16$lat) +
theme_map() + coord_equal()