Download a data frame containing the polygons of Australian federal electorates
Source:R/git-download.R
nat_map_download.RdDownloads and returns a DataFrame containing the points that outline the polygons for each of the Australian electorates in the desired federal election. The data were obtained from the Australian Electoral Commission and the Australian Bureau of Statistics.
nat_map_download(year, ...)Arguments
- year
Desired year, must be one of 2001, 2004, 2007, 2010, 2011, 2013, 2016, 2019
- ...
Additional arguments passed to `download.file`
Value
A data frame consisting of points with the following variables:
id: Numeric identifier for the polygon
long: longitude coordinate of point in polygon
lat: latitude coordinate of point in polygon
order: order for polygon points
hole: whether polygon has a hole
piece: piece for polygon
group: group for polygon
elect_div: Electoral division name
state: Abbreviation for state name
Examples
library(eechidna)
library(dplyr)
library(ggmap)
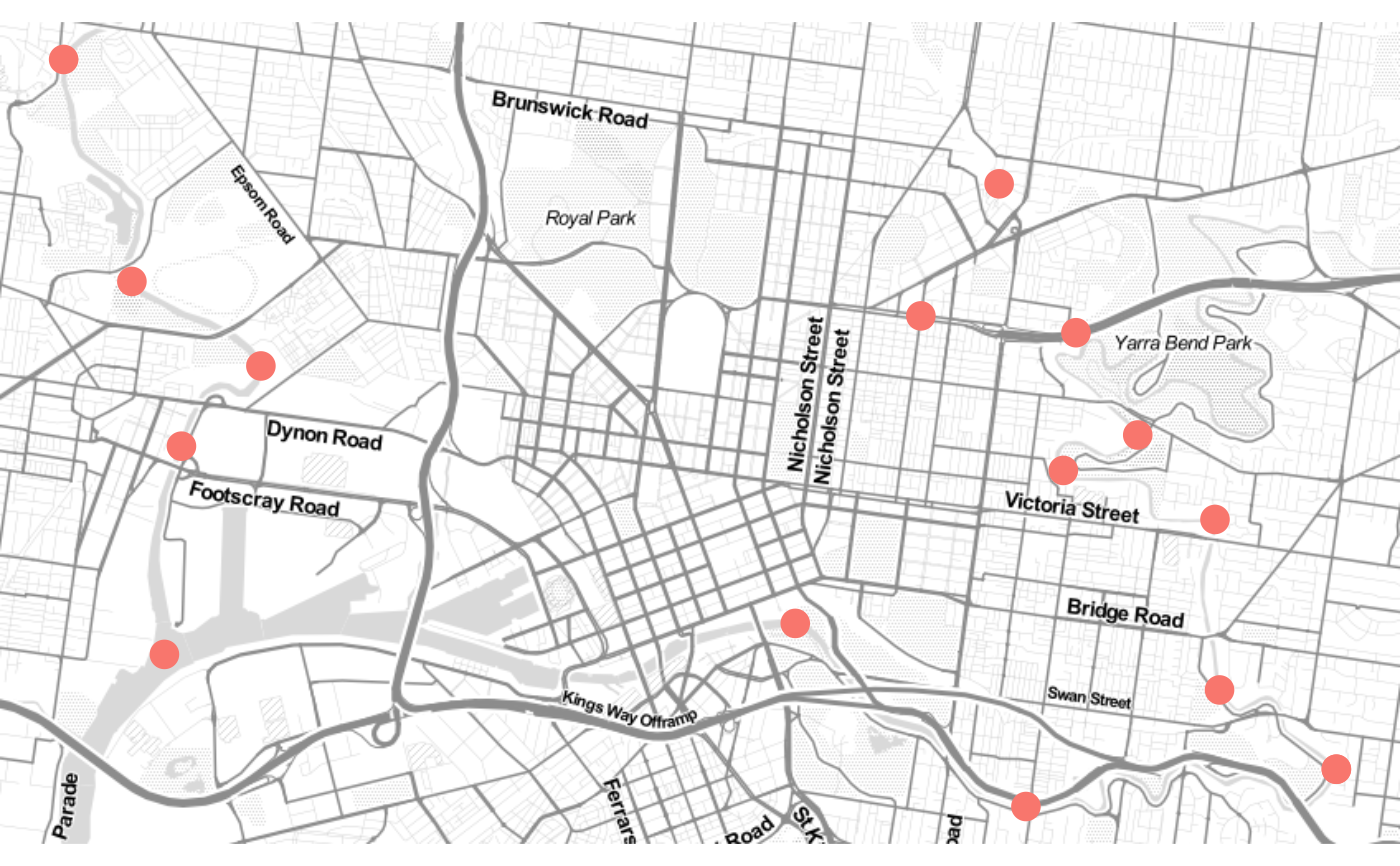
nat_map16 <- nat_map_download(2016)
nat_map16 %>%
filter(elect_div=='MELBOURNE') %>%
qmplot(long, lat, data=., color='red', size=5,
xlab=NA,ylab=NA) +
theme(legend.position = 'none')
#> ℹ Using `zoom = 13`
#> ℹ Map tiles by Stamen Design, under CC BY 3.0. Data by OpenStreetMap, under ODbL.